About this course:
The purpose of this module is to provide an overview of the most common laboratory tests and guide the advanced practice registered nurse’s (APRN’s) interpretation of results of the most common laboratory tests, including the complete blood count (CBC), comprehensive metabolic panel (CMP), lipid panel, thyroid function tests, fasting blood glucose, glycated hemoglobin, and coagulation profile.
Course preview
Interpretation of Common Laboratory Tests for APRNs
The purpose of this module is to provide an overview of the most common laboratory tests and guide the advanced practice registered nurse’s (APRN’s) interpretation of results of the most common laboratory tests, including the complete blood count (CBC), comprehensive metabolic panel (CMP), lipid panel, thyroid function tests, fasting blood glucose, glycated hemoglobin, and coagulation profile.
By the completion of this module, the APRN should be able to:
- identify the most common types of laboratory tests, their indications, and standard reference ranges
- describe the basic interpretation process of laboratory values and their clinical implications
Interpreting laboratory values is a core aspect of patient care and a vital skill for APRNs to master in clinical practice. As with all aspects of patient care, when interpreting laboratory data, it must be correlated with the patient's clinical signs and symptoms. All laboratory data and values in this module are compiled from the American Board of Internal Medicine (ABIM) guide to laboratory reference ranges and refer to healthy, non-pregnant adults. However, it is essential to recognize that normal reference ranges will vary between laboratories (ABIM, 2023).
Abnormal Laboratory Results
Laboratory reports routinely flag abnormal values to alert the ordering provider that a resulting value is outside the normal reference range. The flag can have variable presentations, but the most common flagging methods include an "L" for a result below the lower normal limit, an "H" denoting a value above the upper limit of normal, or an arrow pointing up or down. For critically abnormal values, the result may be accompanied by a "c" for critical or an exclamation point (!) to direct attention to the value. Table 1 provides an example of a lab report highlighting several low blood counts accompanied by small red arrows pointing down (Testing.com, 2021).
Table 1
Laboratory Report Flagging Abnormal Results
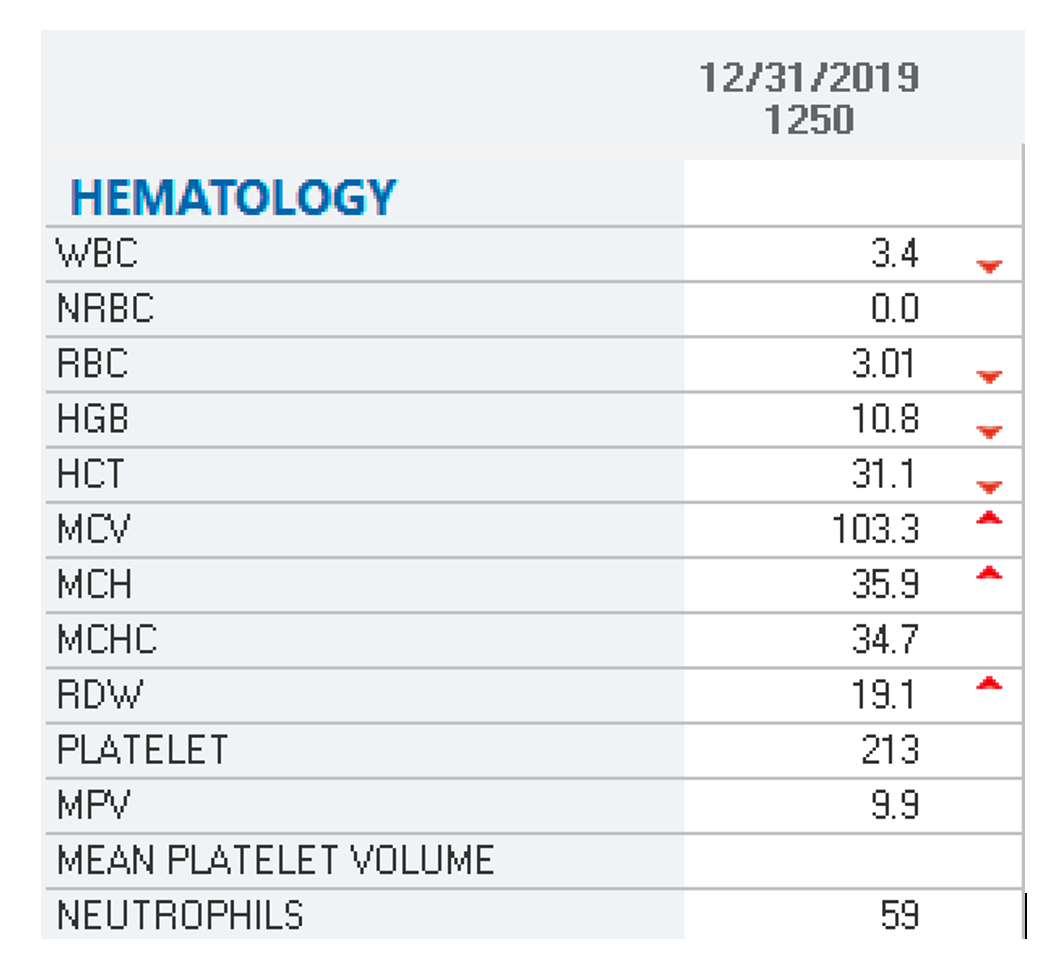
(Selchick, 2020a)
Complete Blood Count
Blood contains liquid and solid components and comprises four main constituents: plasma, red blood cells (RBCs), white blood cells (WBCs), and platelets. Plasma is the liquid part and is primarily water. It carries nutrients, proteins, and hormones throughout the body and transports waste products to the kidneys and digestive tract for removal. The blood's solid components include the complete blood count (CBC) test's fundamental elements: the WBCs, RBCs, and platelets. The CBC is one of the most common laboratory tests performed across healthcare settings, and it consists of several tests in one. It is used to indicate the patient's overall health and to detect and monitor various conditions, including infection, anemia, bleeding, and other blood-related abnormalities. Patients generally do not need to fast or take special precautions before the test. The CBC test can be performed in one of two ways: with differential (CBC w/diff) or without. While the basic CBC test measures the number of RBCs, WBCs, platelets, hemoglobin, hematocrit, and types of WBCs, the CBC w/diff includes a detailed account of the quantities of each type of WBC in the blood. It helps delineate blood abnormalities to diagnose and monitor various conditions (Longo, 2017; MedlinePlus, 2022). Table 2 demonstrates the parts of the CBC w/diff, including normal reference ranges.
Table 2
Components of CBC w/diff and Reference Ranges
Test | Reference Range |
WBC | 4000–11,000/μL |
RBC | 4.20-5.4 M/μL |
Hemoglobin | Female: 12–16 g/dL Male: 14–18 g/dL |
Hematocrit | Female: 37%–47% Male: 42%–50% |
Mean corpuscular volume (MCV) | 80–98 fL |
Mean corpuscular hemoglobin (MCH) | 28–32 pg |
Mean corpuscular hemoglobin concentration (MCHC) | 33–36 g/dL |
Red blood cell distribution width (RDW) | 9.0%–14.5% |
Platelet | 150,000–450,000/μL |
Neutrophils (%) | 50%-70% |
Lymphocytes (%) | 30%-45% |
Monocytes (%) | 0%-6% |
Eosinophils (%) | 0%-3% |
Basophils (%) | 0%-1%% |
Immature granulocytes (%) | 0-0.5% |
Absolute neutrophil count (ANC; #) | 2000–8250/UL |
Absolute immature granulocytes (#) | 0.0-0.17 K/UL |
Absolute lymphocytes (#) | 0.9-4.2 K/UL |
Absolute monocytes (#) | 0.1-1.7 K/UL |
Absolute eosinophils (#) | 0.0-1.0 K/UL |
Absolute basophils (#) | 0.0-0.4 K/UL |
(ABIM, 2023; Longo, 2017)
Red Blood Cells
Erythrocytes are mature RBCs that have an average lifespan of 120 days. Their primary function is to carry hemoglobin, the protein that transports oxygen from the lungs to all the tissues within the body. They are also the pigment component of the RBC responsible for its characteristic red color. The body relies on oxygen as a critical component for all cellular functioning and processes. Hemoglobin also carries waste products (mainly carbon dioxide) from the tissues to the lungs, where waste is expelled through breathing. The RBC result is reported as the number of cells per volume (microliter [μL]), and the hemoglobin is the amount of protein (in grams [g]) per volume (deciliter [dL]). Hematocrit reflects the percentage, by volume, of RBCs in a given amount of blood. Under healthy conditions, the hemoglobin and hematocrit usually exist in a 1:3 ratio, so 14 g of hemoglobin equates to a hematocrit of 42% (Longo, 2017).
Low RBC, hemoglobin, and hematocrit levels generally infer the presence of anemia. Anemia can result from acute blood loss (i.e., hemorrhage from trauma) or slow blood loss over time (i.e., gastrointestinal bleedin
...purchase below to continue the course
The RBCs, hemoglobin, and hematocrit can also be elevated in certain conditions. The most common and easily treatable etiology involves the body's hydration status, which largely influences the hemoglobin and hematocrit levels. In severe dehydration, the hemoglobin and hematocrit are usually falsely elevated due to hemoconcentration, whereas, in overhydration, the hemoglobin and hematocrit are falsely reduced. Polycythemia vera, also called erythrocytosis, is a myeloproliferative disease of the bone marrow, causing an overproduction of RBCs, commonly accompanied by an elevation in leukocytes and platelets. Polycythemia may require treatment with weekly phlebotomies to reduce excess circulating RBCs and induce iron deficiency which decreases RBC proliferation. Hydroxyurea (Hydrea) 500 mg to 1500 mg daily is a second-line treatment that can be adjusted until platelet counts are reduced to less than 500,000/mcL. Treatment with hydroxyurea (Hydrea) is indicated in patients with poor venous access, limited access to a facility that performs phlebotomy, the presence of severe thrombocytosis or intractable pruritis, and in cases that have a high phlebotomy requirement. In patients that are intolerant of or do not respond to hydroxyurea, the JAK2 inhibitor ruxolitinib (Jakafi) can be used; however, there is a risk of anemia. The recommended ruxolitinib (Jakafi) dose is 10 mg, administered twice daily until the hemoglobin falls below 12 g/dL and should be discontinued if the hemoglobin level falls below 8 g/dL. Increased hemoglobin levels may also be seen in patients who smoke cigarettes due to consistent carbon monoxide exposure. Those with underlying respiratory diseases such as chronic obstructive pulmonary disease (COPD), emphysema, or pulmonary fibrosis and those living in high altitudes may present with increased hemoglobin levels. High hemoglobin levels are also typical following vigorous exercise, as well as in athletes who train at high altitudes or who take performance-enhancing drugs such as anabolic steroids, so it is crucial to obtain a detailed history (Pagana et al., 2022; Pillai et al., 2023). The most common etiologies of increased hemoglobin and hematocrit levels include the following:
- polycythemia vera
- dehydration/hemoconcentration
- high altitude
- vigorous exercise
- respiratory disorders (COPD, emphysema, pulmonary fibrosis, asthma)
- smoking and carbon monoxide exposure (seen in individuals that work on cars or in boiler rooms)
- renal disorders (renal artery stenosis, renal cysts, kidney cancer)
- anabolic steroids or other performance-enhancing drugs (Pillai et al., 2023)
While the CBC w/diff provides essential data regarding the presence and features of anemia, a complete anemia workup requires an anemia panel (Longo, 2017). For a more detailed account outlining the various types of anemias, refer to the NursingCE.com course, Anemia: Diagnosing, Classifying, and Managing Anemia in Adults.
White Blood Cells
WBCs are also called leukocytes and are the essential cells of the immune system. While WBCs only comprise about 1% of all blood cells in healthy adults, they serve critical functions in fighting infection and mediating the inflammatory process. WBCs have variable lifespans; some live for only 24 hours; however, the average WBC lifespan is 13 to 20 days. There are five specific subtypes of WBCs: neutrophils, lymphocytes, monocytes, basophils, and eosinophils. Each subtype serves a distinct function, and collectively they comprise the "differential" component of the CBC. When the total WBC count is abnormally elevated, it is called leukocytosis, which is most commonly an indicator of an acute bacterial infection or an inflammatory process. However, a high WBC does not always indicate a pathologic process, as there can be physiological causes of leukocytosis (i.e., stress, pregnancy, steroid therapy, or vigorous exercise). When leukocytosis occurs, the CBC's differential provides information about each WBC subtype's relative percentage and absolute number. A lower-than-normal WBC count is called leukopenia and increases the risk of acquiring an infection (Longo, 2017).
Neutrophils may also be called segmented neutrophils (segs) or polymorphonuclear cells (polys or PMNs). They are the main WBC used for fighting and preventing infections, as they are primed to destroy and ingest any potential bacterial intruder. Neutrophils arrive first at the site of inflammation or injury. Therefore, neutrophil elevations are usually seen early in injury or illness. The ANC measures the total number of neutrophils circulating in the blood, which correlates directly with the patient's risk level for acquiring an infection. This value is particularly important to monitor in patients undergoing myelosuppressive treatment for cancer. Most laboratories designate an ANC level of less than 1500 as abnormal or neutropenia. When a patient is neutropenic, they are at high risk for developing a severe illness, including life-threatening sepsis. Bands are immature neutrophils that are typically released following acute injury or inflammation. The presence of bands indicates the presence of an inflammatory process, as the bone marrow has increased production of WBCs and is releasing them into circulation before they are fully mature. An increase in the number of bands is commonly referred to as a left shift or shift to the left (Pagana et al., 2022).
Lymphocytes primarily fight viral infections, and there are two major types: B and T cells. B cells make antibodies in response to antigens (foreign substances) to provide future immunity to that specific antigen. T cells help to destroy cancer cells and also help to control the immune response against foreign substances. Monocytes are phagocytic cells that fight off viruses, fungi, and bacteria. Their job is to remove foreign materials, such as dead or injured cells, microorganisms, and other particles, from the injury site to facilitate healing and prevent further injury or infection. Basophils help prevent blood from clotting within the microcirculation and are also involved in the inflammatory response, particularly in modulating hypersensitivity reactions to allergens. In addition to their presence in the blood, basophils are found within the gastrointestinal tract and skin, where they are referred to as mast cells. Mast cells contain heparin and histamine and are involved in allergic and stress responses. Eosinophils also mediate allergic and inflammatory reactions and are essential in fighting parasitic infections. Eosinophils are present in the respiratory tract and airway, serving similar functions in response to allergic reactions (Pagana et al., 2022).
Platelets
Platelets, or thrombocytes, are small blood cell fragments that have a primary role in the blood clotting process. In response to an injury, laceration, or blunt trauma, platelets gather at the site of an injury to seal cuts or breaks in blood vessels in conjunction with proteins called clotting factors to control bleeding. Platelets have an average lifespan of 7 to 10 days. Thrombocytopenia occurs when the platelet count declines beneath the normal range, heightening the patient's risk for bruising and acute bleeding events. Spontaneous hemorrhage and death can ensue in the most severe cases, notably when the platelet count drops below 20,000/µL (Longo, 2017). Thrombocytopenia can have various etiologies; it can be idiopathic, due to the destruction of platelets caused by medications such as chemotherapy or certain antibiotics, as a side effect of radiation therapy, or as a result of decreased production of platelets caused by a viral infection. Aplastic anemia and idiopathic thrombocytopenic purpura (ITP) are rare autoimmune bleeding disorders affecting the platelet count. In aplastic anemia, the body fails to produce platelets in sufficient quantities, whereas in ITP, the immune system attacks and destroys the platelets. An increased platelet level (thrombocytosis) can occur in splenomegaly, as a byproduct of inflammation, due to stress hormones or from myeloproliferative bone marrow disorders such as polycythemia vera or chronic granulocytic leukemia (Pagana et al., 2022).
Comprehensive Metabolic Panel
The comprehensive metabolic panel (CMP), or the blood chemistry panel, provides information about several body systems and organ health. It measures glucose levels, liver and kidney function, and fluid and electrolyte balance. There is no special preparation before the test; patients generally do not need to fast for a routine CMP. However, the exception is if the liver function tests are being scrutinized regarding response to a medication or other underlying condition, which may require the patient to fast (Pagana et al., 2022). Table 3 provides a sample CMP report highlighting the relevant components of the test and the accompanying normal reference ranges.
Table 3
Comprehensive Metabolic Panel
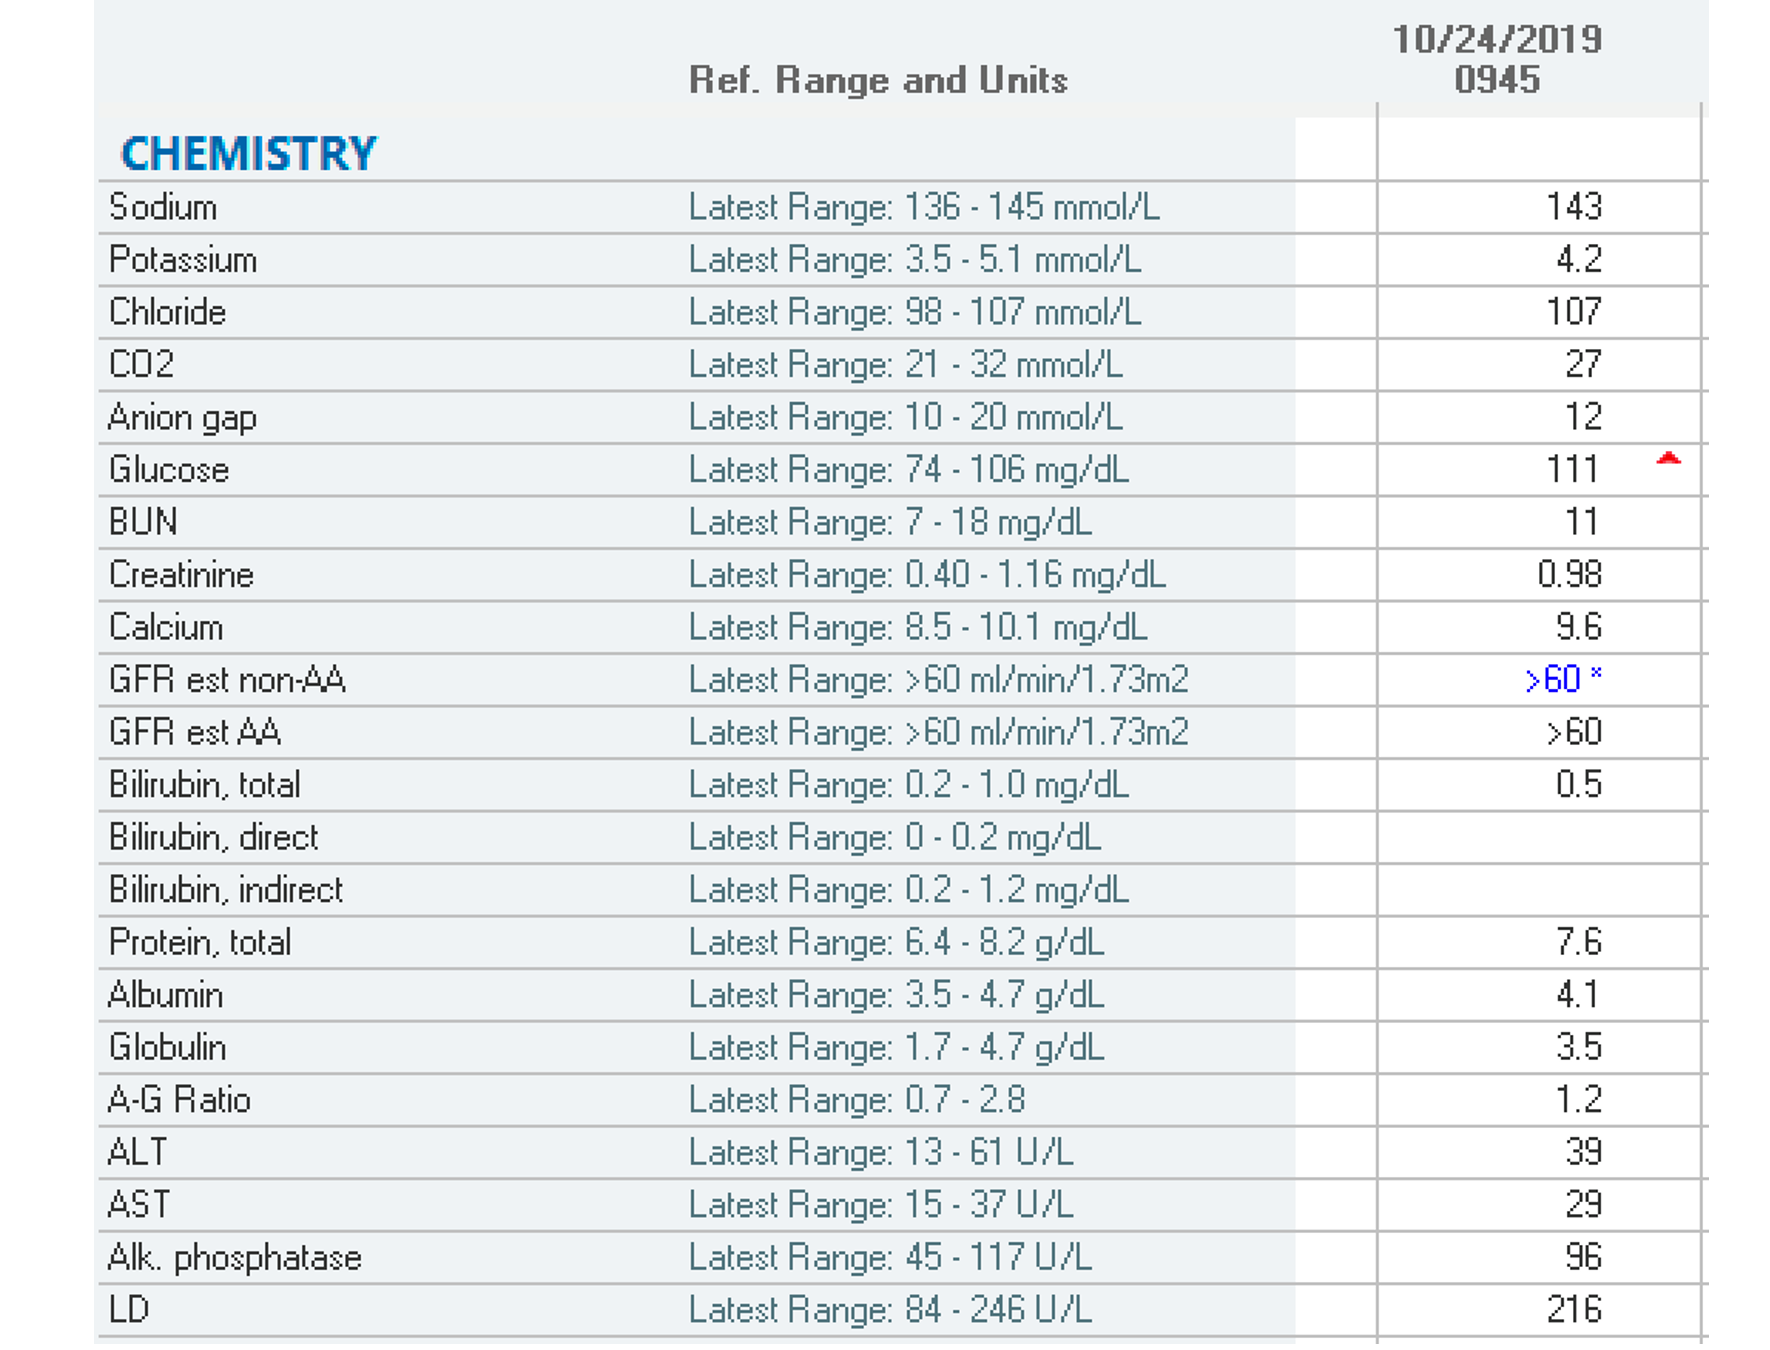
(Selchick, 2020b)
Electrolytes
Electrolytes are essential for basic bodily functions. Embedded within the CMP are five significant serum electrolytes: sodium, potassium, calcium, chloride, and bicarbonate (Shrimanker & Bhattarai, 2023).
Sodium
Sodium helps regulate and maintain extracellular fluid balance and is vital in muscle contraction and nerve impulse. Hyponatremia, when sodium levels drop below the normal range, results from water retention or sodium loss. Hyponatremia can occur due to vomiting, diarrhea, or diuresis from medication therapy. Hyponatremia may be secondary to a more significant etiology, such as an underlying liver or renal disorder (chronic renal disease), hormonal abnormality (adrenal insufficiency), congestive heart failure, or excessive water intake. Of all electrolyte imbalances, hyponatremia is the most common. Symptoms of hyponatremia may include confusion, headache, muscle weakness, spasms/cramps, seizures, restlessness, and irritability. Hypernatremia (i.e., a sodium level above the normal range) is typically due to water depletion secondary to insufficient water intake, excessive sweating, water loss, or excessive sodium intake. Symptoms of hypernatremia may include excessive thirst, lethargy, fatigue, tachypnea, insomnia, restlessness, and confusion. Hyponatremia and hypernatremia can also be due to the presence of more severe underlying conditions such as interstitial nephritis, diabetes insipidus, or excessive mineralocorticoid (hyperaldosteronism, Cushing's syndrome, or corticosteroids; adrenal glands; Pagana et al., 2022; Shrimanker & Bhattarai, 2023).
Potassium
Potassium is the primary intracellular ion and helps regulate the communication channels between nerve fibers and muscles, serving an essential role in heart contraction and muscle functioning. Hypokalemia results when the potassium level drops below the normal range. There are three primary etiologies of hypokalemia: urinary loss (usually drug-induced by diuretic medications), gastrointestinal loss (usually due to diarrhea, vomiting, or malabsorption), or the movement of potassium from extracellular to intracellular fluid (due to alkalosis or insulin or glucose administration). Symptoms of hypokalemia may include constipation, muscle weakness or spasms, numbness or tingling sensations, cardiac arrhythmia, flattened T waves, prominent U waves, and fatigue. Hyperkalemia occurs when the potassium level is higher than the upper limit of normal and can be due to increased dietary potassium intake or impaired renal clearance secondary to acute or chronic renal failure, the most common cause of hyperkalemia. Hyperkalemia can also be drug-induced by potassium-sparing diuretics such as aldosterone antagonists (i.e., spironolactone [Aldactone]). If a serum sample is hemolyzed (cells are ruptured) during sample collection or processing, hyperkalemia can be inaccurately reported on the lab results, reinforcing the need to associate all laboratory data with the patient's clinical presentation. Symptoms of hyperkalemia may include muscle fatigue, weakness, paralysis, cardiac arrhythmias, peaked T waves, widened QRS complex, and nausea. Because more than 90% of potassium is excreted in the urine, which is then filtered and reabsorbed proximally before being excreted by the distal tubules, it is not uncommon for patients with severe renal disease to exhibit abnormal potassium levels (Pagana et al., 2022; Shrimanker & Bhattarai, 2023).
Calcium
Calcium is one of the body's essential minerals required for muscle contraction, nerve function, and healthy bones and teeth. Calcium also serves a vital role in blood clotting and cellular division. The CMP reports only the total calcium level in the bloodstream. Low calcium levels, or hypocalcemia, may be caused by hypoparathyroidism, renal failure, vitamin D deficiency or insufficiency, magnesium deficiency, acute pancreatitis, or other conditions. Symptoms of hypocalcemia most commonly include paresthesia, muscle spasms or cramps, tetany, numbness, and in severe cases, seizures. Higher than normal calcium levels, or hypercalcemia, may be due to hyperparathyroidism, tuberculosis, or drug-induced secondary to diuretics, calcium-containing antacids, or excess vitamin D intake. Hypercalcemia also raises suspicion of malignancy, especially metastatic breast or lung cancer or multiple myeloma. In its most severe form, hypercalcemia related to malignancy is considered a life-threatening medical emergency. Symptoms of hypercalcemia include excessive thirst, frequent urination, bone pain, muscle weakness, confusion, fatigue, or rarely, palpitations or cardiac arrhythmias. Since calcium in the blood is bound to albumin, the total calcium level reported may be an inaccurate representation of the free (ionized) calcium in patients with high or low albumin levels. Therefore, it is essential to determine the accurate (corrected) calcium level before treating abnormally high or low calcium. Several online calculators are available to assist clinicians (see Figure 1 for an example; (Goltzman, 2023).
Figure 1
Corrected Calcium Formula

(Goltzman, 2023)
Chloride and Bicarbonate
Chloride helps to regulate fluid balance within the body, and bicarbonate provides information regarding the acid-base status. Due to their direct inverse relationship, the clinical significance of chloride and bicarbonate should always be interpreted together and in conjunction with the anion gap. The anion gap is a calculated result that measures how much acid is in the blood, which provides valuable information for delineating the etiology of acid-base disturbances. These tests help to distinguish between respiratory alkalosis (acute versus chronic) and metabolic acidosis. They can also help to identify diabetes insipidus, renal tubular acidosis, Addison's disease, hyperparathyroidism, or Cushing syndrome (Pagana et al., 2022; Shrimanker & Bhattarai, 2023).
Renal Function
While the electrolyte panel provides valuable information regarding renal function, three tests within the CMP explicitly evaluate the health status and functioning of the renal system: blood urea nitrogen (BUN), creatinine, and estimated glomerular filtration rate (eGFR; Gounden et al., 2022).
Blood Urea Nitrogen
Urea is a nitrogen-containing waste product generated from the breakdown of dietary protein within the liver. It is released into the blood and circulates until it is excreted. Approximately 85% is filtered by the kidneys and excreted via the urine; the rest is excreted in the stool. The BUN measures the amount of waste products in the blood. The BUN increases when the kidneys are not functioning correctly. This can be due to easily correctable causes such as dehydration, diarrhea, a high-protein diet, or certain nephrotoxic medications, including chemotherapy or steroids. Alternatively, an elevated BUN may indicate a more complex condition such as congestive heart failure, renal disease (e.g., glomerulonephritis, pyelonephritis, or tubular necrosis), tissue necrosis, shock, or severe burns. A low BUN level is not as common and generally due to fluid overload, syndrome of inappropriate antidiuretic hormone (SIADH), pregnancy, malnutrition, or liver failure (Gounden et al., 2022; Pagana et al., 2022).
Creatinine
Creatinine is a chemical waste byproduct of creatine phosphate, essential in creating muscle energy and skeletal muscle contraction. Produced primarily in the liver, creatine is transported to the muscles and is phosphorylated into creatine phosphate. Creatinine is excreted solely by the kidneys and is a good indicator of kidney function, although levels can vary widely based on age, gender, and body size (muscle mass). High creatinine levels generally indicate kidney dysfunction, which may be secondary to dehydration, starvation, acute trauma, infection, urinary tract obstruction, burns, or acute or chronic kidney failure. Low creatinine levels indicate the presence of decreased muscle mass, which may result from an underlying condition such as muscular dystrophy or myasthenia gravis (Pagana et al., 2022).
Glomerular Filtration Rate
The eGFR is the most sensitive and widely utilized test to measure how well the kidneys function and stage existing kidney disease. The eGFR reflects the creatinine level in the blood, using a specific formula to calculate a result based on the patient's age, gender, and body size. The normal eGFR in adults is greater than 90 ml/min/1.73 m2, but as demonstrated in Table 3, a normal eGFR is commonly reported as greater than 60 ml/min/1.73 m2. Chronic kidney disease (CKD) is staged based on the eGFR value and reflects the severity of impairment. An eGFR below 60 for at least three months or an eGFR above 60 with kidney damage (marked by high levels of albumin in the urine) indicates CKD (Kidney Disease Improving Global Outcomes (KDIGO), 2021). The KDIGO stages of chronic kidney disease are as follows:
- Stage 1: eGFR higher than 90 ml/min/1.73 m2 (the patient has 90% to 100% of kidney function)
- Stage 2: eGFR between 60 and 89 ml/min/1.73 m2 (the patient has 60% to 89% of kidney function)
- Stage 3a: eGFR between 45 and 59 ml/min/1.73 m2 (the patient has 45% to 59% of kidney function)
- Stage 3b: eGFR between 30 and 44 ml/min/1.73 m2 (the patient has 30% to 44% of kidney function)
- Stage 4: eGFR between 15 and 29 ml/min/1.73 m2 (the patient has 15% to 29% of kidney function)
- Stage 5: eGFR less than 15 ml/min/1.73 m2 (the patient has less than 15% of kidney function; classified as end-stage renal failure; Gounden et al., 2022; KDIGO, 2021)
Liver Function Tests
Liver function tests (LFTs), often called the hepatic panel, measure specific enzymes and proteins in the blood and provide information about the liver. LFTs may be used to diagnose liver disease, pinpoint the location of liver damage, screen for infection, monitor the side effects of hepatotoxic medications, or determine the effectiveness of drugs used to treat liver disease. As noted above, patients may be asked to fast for at least eight hours before having an LFT performed, as a higher-than-normal level can be related to liver disease, bile duct problems, or alcohol abuse. Patients may also be advised to avoid alcohol and certain prescription drugs the day before the test, as they can affect the results (Lala et al., 2023; Pagana et al., 2022).
Bilirubin
Bilirubin is the byproduct of the breakdown of RBCs, and it is reported in three values: total, direct, and indirect. Total bilirubin is a combination of both direct and indirect bilirubin values. Indirect (unconjugated) bilirubin is the amount of bilirubin bound to albumin and circulating through the bloodstream. Indirect bilirubin is insoluble in water and cannot be excreted in the urine. The liver absorbs indirect bilirubin, which is conjugated with glucuronic acid to a water-soluble form. Direct (conjugated) bilirubin is then secreted into bile and transported through the gallbladder and digestive tract before being excreted in the stool. Hyperbilirubinemia occurs when there is an increase in bilirubin production or a decrease in uptake or conjugation of indirect bilirubin or excretion. Since bilirubin is a yellowish substance, pathologic accumulation in the blood can lead to jaundice or yellowing of the skin (mucosal membranes) and eyes (scleral icterus). Hyperbilirubinemia can cause abdominal pain, fevers, chills, systemic pruritus, dark-colored urine, fatigue, weakness, nausea, or vomiting. The differential diagnosis of hyperbilirubinemia can vary widely, but the most common etiologies of hyperbilirubinemia include liver disease, bile duct inflammation or blockage, gallstones, cholelithiasis, or hemolytic anemia. When interpreting bilirubin values, it is essential to consider the patient's age and other health conditions (Lindenmeyer, 2022; Pagana et al., 2022).
Indirect (unconjugated) Bilirubin. At least 70 to 85% of bilirubin should be unconjugated in healthy adults. Liver disease can be excluded as the culprit when the total bilirubin level is elevated, and the breakdown of the direct and indirect values reveals that at least 75% is unconjugated. Hemolysis or Gilbert's syndrome are more likely etiologies; both conditions usually demonstrate normal direct bilirubin levels. Gilbert's syndrome is a genetic liver condition seen in approximately 5% of the population that impairs the liver's ability to process bilirubin correctly. It generally causes mild hyperbilirubinemia without clinical symptoms (Lindenmeyer, 2022; Pagana et al., 2022).
Direct (conjugated) bilirubin. Direct bilirubin is considered the most sensitive test in diagnosing liver disease. Therefore, elevated levels of direct bilirubin are often accompanied by elevated liver enzymes. When direct bilirubin is elevated, it will spill over into the urine, suggesting a problem with bilirubin metabolism or excretion. The most common etiologies include gallstones, extensive liver metastasis, alcohol abuse, hepatocellular disease, drug reactions, and biliary tract obstruction (extrahepatic or intrahepatic; Lindenmeyer, 2022; Pagana et al., 2022).
Liver Enzymes
Liver enzymes that are evaluated include alanine aminotransferase (ALT), aspartate aminotransferase (AST), and alkaline phosphatase (ALP). These tests further assess the liver’s function and detect liver injury or disease. ALT, AST, and ALP elevations are most commonly drug-induced due to lipid-lowering statin therapy (i.e., atorvastatin [Lipitor]), chemotherapy, or numerous other medications processed through the liver. Elevations may also be related to excess alcohol consumption, underlying cirrhosis, or fatty liver. An AST/ALT ratio greater than one may indicate liver cirrhosis or the presence of liver metastasis. An AST/AT ratio of less than one may indicate viral hepatitis, acute hepatitis, or infectious mononucleosis (Lindenmeyer, 2022; Pagana et al., 2022).
ALT. ALT is an enzyme primarily produced by the liver and found in high concentrations within the hepatocytes (liver cells). The ALT is considered the most specific test when evaluating liver injury, as it directly indicates hepatocellular injury (hepatic jaundice). Moderately or mildly increased levels may occur due to cirrhosis, obstructive jaundice, severe burns, pancreatitis, or infectious mononucleosis (Lindenmeyer, 2022; Pagana et al., 2022).
AST. AST is an enzyme in highly metabolic tissues such as heart or skeletal muscle tissue, liver cells, kidneys, pancreas, and RBCs. While elevations in AST can infer liver damage, they can also be seen in cases of acute cardiac muscle injury (i.e., myocardial infarction), skeletal muscle injury, heat stroke, and progressive muscular dystrophy (Lindenmeyer, 2022; Pagana et al., 2022).
ALP. ALP is an enzyme concentrated within the liver, biliary tract, epithelium, and bone cells. Most extrahepatic ALP comes from the bones. Due to this, elevations in ALP can indicate liver damage or bone problems such as rickets, Paget's disease, or bone cancer (primary bone tumors or metastatic bone lesions). Due to the different sources of elevated ALP, isoenzymes are measured to differentiate between hepatic or bone factors. ALP1 is expected to be elevated when liver disease is the elevation source. ALP2 is elevated when there is an underlying bone disease. When ALP is elevated due to liver pathology, it primarily responds to cholestasis (a decrease in bile flow due to post-hepatic or obstructive jaundice; Lindenmeyer, 2022; Pagana et al., 2022).
Lactate Dehydrogenase
Lactate dehydrogenase (LDH), or lactic acid/lactate dehydrogenase, is an enzyme in the blood that generates energy within the body. LDH is widespread throughout nearly all body tissues. When tissues become damaged, they release LDH into the blood, making it a nonspecific marker of tissue damage and inflammation. Patients with metastatic cancer often have elevated LDH levels due to cancer spread or liver damage from cancer treatments. LDH can be elevated in conditions such as acute myocardial infarction, skeletal muscle disease, tissue necrosis, shock, congestive heart disease, systemic infections, liver disease, and beyond (Pagana et al., 2022).
Total Protein
Protein is necessary for cellular growth, development, and overall health. The total protein is the sum of two circulating proteins in the blood: albumin and globulin. Therefore, the total protein is easier to interpret with the albumin and globulin values, also reported within the CMP. Albumin is produced within the liver and is the predominant protein within the bloodstream, accounting for approximately 60% of the total protein. The albumin provides essential information about nutritional status; hypoalbuminemia (decreased albumin level) is commonly seen in malnutrition and malabsorptive disorders. The albumin also serves as a marker of liver and kidney damage, as albumin production within the liver is decreased in severe liver disease or inflammation. Typically, the only clinically significant cause of increased albumin levels is dehydration. Globulins comprise the remaining 40% of the protein in the bloodstream; they assist the immune system with fighting infection and transporting nutrients. Globulins may increase in the presence of infection, inflammation, and some types of cancers, particularly plasma cell tumors and lymphomas (Pagana et al., 2022).
The A-G ratio refers to the albumin ratio in relation to the amount of globulin present in the blood. It is calculated automatically by many labs and reported in CMP results. The A-G- ratio should be slightly higher than 1 in healthy adults. It can provide insight into the etiology of changes in the total serum protein value. Higher than normal A-G ratios are often due to the underproduction of globulins and can be caused by hypothyroidism, glucocorticoid excess, certain types of blood cancers such as leukemia, and some genetic disorders. Low A-G ratios may indicate an autoimmune disorder, cirrhosis, or kidney disease (Pagana et al., 2022).
Lipid Panel
A lipid panel (or lipid profile) measures the amount of cholesterol and triglycerides within the blood. Lipids are fats and fatty substances within the blood that serve as energy sources and are required by the body to maintain the health of cells and specific cellular functions. These are either synthesized by the liver or absorbed from the diet. When cholesterol is present in excess, it can lead to atherosclerosis or the buildup of fatty plaque within the arteries. Plaque growth within the arteries leads to damage, narrowing, or blockage of the arteries and blood vessels, which can develop into coronary artery disease (CAD) and lead to myocardial infarction and stroke. Hyperlipidemia, or high cholesterol levels, is considered a significant risk factor for cardiovascular and blood vessel disease, but this usually does not cause any warning signs or symptoms. Therefore, the lipid panel provides valuable information regarding a patient's risk for atherosclerosis and is also performed when monitoring response to lipid-lowering therapy. As demonstrated in Table 4, a standard lipid panel includes total cholesterol, high-density lipoprotein cholesterol (HDL-C), low-density lipoprotein cholesterol (LDL-C), and triglycerides. Since dietary intake can impact the lipid panel results, patients are advised to fast for at least eight hours before the test. Patients should also be advised to take their usual medications with water only (Bakerman et al., 2014; Pagana et al., 2022). The reference ranges listed in Table 4 are values based on fasting.
Table 4
Lipid Panel Components and Reference Ranges
Test | Interpretation | Reference Range |
Total Cholesterol |
| < 200 mg/dL 200-239 mg/dL > 239 mg/dL |
HDL-C | Optimal Low | > 50 mg/dL (women), >40 mg/dL (men) < 50 mg/dL (women), <40 mg/dL (men) |
LDL-C | Optimal Near optimal Borderline-high High Very High | < 100 mg/dL 100-129 mg/dL 130-159 mg/dL 160-189 mg/dL > 189 mg/dL |
Triglycerides | Optimal Normal Borderline-high High Very High | < 100 mg/dL < 150 mg/dL 150-199 mg/dL 200-499 mg/dL > 499 mg/dL |
(ABIM, 2023)
HDL-C is considered good cholesterol, as high levels are cardioprotective and associated with a reduced risk of cardiovascular and blood vessel disease. Since HDL-C takes up excess cholesterol and carries it to the liver for removal, the higher the HDL-C, the better. Alternatively, decreased levels of HDL-C are associated with an increased risk of cardiovascular disease, especially in males. LDL-C is considered bad cholesterol, as high levels are linked to increased cardiovascular damage, atherosclerosis, and associated morbidity and mortality. LDL-C deposits excess cholesterol in the walls of blood vessels. Generally, the higher the LDL-C, the greater the risk for fatty plaque buildup within the arteries. The basis for cholesterol management is centered on lipid-lowering agents and diets targeting a reduction in LDL-C. Like LDL-C, high triglyceride levels are associated with an increased risk of cardiovascular and blood vessel disease (Bakerman et al., 2014).
Elevated LDL-C and triglycerides levels are closely linked to unhealthy lifestyle choices such as a poor diet (excess intake of fatty foods and simple sugar), a sedentary lifestyle (lack of physical activity), obesity and excess weight, smoking or exposure to tobacco smoke, and excessive alcohol intake (Grundy et al., 2019). Hyperlipidemia and type 2 diabetes mellitus (T2DM) commonly occur together. Patients with T2DM have a higher prevalence of lipid abnormalities in the peripheral venous circulation, increased atherosclerotic plaque accumulation, and smaller coronary artery lumen diameter than those without T2DM. The American Diabetes Association (ADA) recommends that patients with T2DM strive for lower target cholesterol levels than those listed in Table 4 (Joseph et al., 2022). Optimal cholesterol values for patients with T2DM include:
- LDL-C: < 100 mg/dL,
- HDL-C: > 40 mg/dL (men) or > 50 mg/dL (women)
- Triglycerides < 150 mg/dL (Joseph et al., 2022)
Triglycerides can also be elevated in specific disease processes, including acute pancreatitis, alcoholism, and gout, or due to certain medications such as oral contraceptives. Lipid levels can also be elevated due to a strong family history, and in some cases, due to a genetic condition known as familial hypercholesterolemia (FH). Patients with FH have a genetic mutation that impairs the body's ability to remove excess LDL-C from the bloodstream, causing high LDL-C levels. Over time, the high levels of LDL-C build up within the arteries, amplifying the risk for early onset of cardiovascular disease and vessel blockage. To reduce cardiac damage and FH-induced morbidity and mortality, treatment for FH should begin early in life. Therefore, obtaining a detailed family history is essential to monitor and screen patients appropriately (Vaezi & Amini, 2022).
Evaluating all aspects of the lipid panel before making a diagnosis and initiating interventions is essential. The total cholesterol measures all the cholesterol in all the subtypes of lipoprotein particles. Therefore, a marked elevation in the HDL-C level can cause the total cholesterol to exceed the upper limit of normal, but this does not equate to increased atherosclerosis risk since HDL-C is a cardioprotective factor (Pagana et al., 2022).
Thyroid Function Tests
Thyroid function tests (TFTs) are performed to determine if the appropriate amount of thyroid hormone is present within the bloodstream. TFTs may be ordered individually or collectively as a group (thyroid panel) to help diagnose or monitor thyroid disorders. The thyroid gland has several vital functions and is responsible for maintaining various aspects of homeostasis within the body, including regulating body temperature, metabolism, and calcitonin. It also impacts the way tissues outside the thyroid function. The thyroid gland generates two primary hormones: thyroxine (T4) and triiodothyronine (T3). T4 contains four iodine atoms and is converted to T3, which contains three iodine atoms and has a stronger and more rapid metabolic action than T4. The pituitary gland regulates the amounts of T4 and T3 secreted into the blood (Ross, 2022).
Interpreting TFTs can be daunting and requires a rudimentary understanding of how thyroid hormones are produced and released. As demonstrated in Figure 2, the release rate of T3 and T4 is controlled by the anterior pituitary gland and hypothalamus, which acts as a sensory controller. The hypothalamus initiates the process by secreting thyrotropin-releasing hormone (TRH). TRH is essentially the first thyroid messenger signal, as it stimulates the release of thyroid-stimulating hormone (TSH) from the anterior pituitary gland. TSH is critical in modulating the release of T4, which is then converted to T3. The amount of TSH that the pituitary releases into the bloodstream depends on the amount of T4 that the pituitary perceives, as it functions on a negative feedback system. The pituitary constantly measures the amount of T3 and T4 and responds to changes to maintain an appropriate balance. If the pituitary senses insufficient T4, it will ramp up the TSH production, signaling the thyroid gland to produce more T4. Once the level of T4 reaches a specific level within the blood, TSH production decreases (Ross, 2022).
Figure 2
Thyroid Hormones

Thyroid disease is most characterized as overactive (hyperthyroidism) or underactive (hypothyroidism). Hypothyroidism is classified as primary or secondary; primary is much more common. Hashimoto's thyroiditis, an autoimmune disease that causes the body to attack the thyroid gland, is the most common cause of primary hypothyroidism in the US. Secondary hypothyroidism is caused by the failure of the pituitary gland or hypothalamic disease, whereby the body does not make adequate amounts of TSH to stimulate the release of T3 and T4 (Braunstein, 2022b). The differential diagnosis for hyperthyroidism is more complex and includes thyrotoxicosis, Grave's disease, and subacute thyroiditis. The main distinction between hyperthyroidism and thyrotoxicosis is in the underlying pathophysiology of the hormones. Hyperthyroidism is characterized by the increased production and secretion of T3/4 from the thyroid gland and includes three primary subtypes: thyrotoxicosis, Grave's disease, and subacute thyroiditis. Thyrotoxicosis is a clinical disorder with excess circulating T3 and T4, irrespective of the source. Graves' disease is an autoimmune disorder that leads to hyperthyroidism, as the body attacks the thyroid gland, inducing overactivity. While it carries many of the same symptoms of hyperthyroidism, Grave's disease has characteristic physical signs, including exophthalmos (prominence of the eyes), goiter, and extraocular muscle weakness (Braunstein, 2022a). Table 5 outlines the most common clinical features of hypothyroidism and hyperthyroidism.
Table 5
Clinical Features of Hypothyroidism vs. Hyperthyroidism
Hypothyroidism | Hyperthyroidism |
Depression | Anxiety, irritability |
Physical tiredness | Fatigue, restlessness |
Weight gain | Weight loss despite increased appetite |
Coarse, dry skin | Hair loss |
Hoarseness | Tremors |
Cold intolerance | Heat intolerance |
Diminished sweating | Increased sweating |
Constipation | Increased frequency of stools |
Menorrhagia | Amenorrhea or oligomenorrhea |
(Braunstein, 2022a, 2022b)
A thyroid panel typically comprises three main tests: free T4 (FT4), free T3 or total T3, and TSH, described in Table 6. Patients are not advised to fast before the test, as some clinical studies have demonstrated that early morning fasting leads to higher TSH levels compared to tests performed in the afternoon on patients who did not fast. Before TFTs, patients should be screened for any iodine contrast administration within the previous ten days of the test, as the thyroid takes up iodine and can skew results. TFT results can be altered in pregnant patients or those who take estrogen medications such as oral contraceptives or hormone replacement therapy. Patients should also be counseled to stop biotin (an over-the-counter supplement rich in B vitamins) at least two days before having their TFTs performed, as this supplement is known to interfere with the accuracy of TFT results (Ross, 2022).
Table 6
Thyroid Panel
Test | Reference Range |
TSH | 0.5–4.0 μU/mL (0.5–4.0 mU/L) |
Thyroxine (T4, Total) Free thyroxine (FT4) | 5-12 μg/dL 0.8–1.8 ng/dL |
Triiodothyronine (T3, Total) Triiodothyronine (T3, Reverse) Triiodothyronine (T3, Free) | 80–180 ng/dL 20-40 ng/dL 2.3-4.2 pg/mL |
(ABIM, 2023)
Thyroid Stimulating Hormone
TSH is the first-line screening test for patients with suspected thyroid dysfunction. The level of circulating TSH in the blood is used to determine if the thyroid is functioning correctly or is overactive or underactive. If the TSH is high, the thyroid gland is not producing enough T3 or T4, which would raise clinical suspicion for primary hypothyroidism. Conversely, if the TSH is low, it usually suggests that the thyroid produces too much T3 and T4, raising clinical suspicion for hyperthyroidism. Less commonly, a low TSH level may be caused by an abnormality in the pituitary gland or hypothalamic disease, preventing the body from making adequate amounts of TSH to stimulate the release of T3 and T4. This condition is referred to as secondary hypothyroidism (Ross, 2022). The most recent guideline from the US Preventive Services Task Force (USPSTF) recommends that multiple tests over three to six months be performed to confirm abnormal TSH results (LeFevre & USPSTF, 2015).
T4 Tests
T4 can be measured as total T4 or FT4. Total T4 measures both the free and the bound hormone available, whereas FT4 measures the T4 hormone freely circulating in the blood and available for use. FT4 is more commonly performed as it provides the most insight into the severity of an abnormal TSH level. FT4 is most accurate when performed with the TSH level; therefore, these tests are usually ordered together (Ross, 2022). When interpreting the FT4, the APRN must exclude conditions that are commonly associated with transient elevations of the FT4, such as:
- amphetamine abuse
- high altitude exposure
- selenium deficiency
- amiodarone (Pacerone)
- hyperemesis gravidarum
- acute psychosis
- estrogen withdrawal
- iodide administration (DeGroot, 2016)
T3 Tests
T3 can be evaluated as either total T3 or free T3; however, free T3 is less reliable and typically not clinically indicated in suspected thyroid disease. Total T3 testing is reserved for detecting hyperthyroidism or determining its severity. T3 testing is not clinically useful in detecting hypothyroidism, as the TSH and FT4 are typically abnormal earlier in disease progression than the T3 level. Even patients with severe hypothyroidism may present with a T3 that is within normal limits. Reverse T3 is another thyroid test that is less commonly performed. It measures inactive thyroid hormone and is only indicated in evaluating patients with suspected hyperthyroidism (Ross, 2022). Clinicians must determine the TSH first when interpreting TFTs individually. If the TSH is normal, then no further testing is indicated. If the TSH is high, hypothyroidism is suspected, and the FT4 should be evaluated to determine the degree of hypothyroidism. If the TSH is low, FT4 and T3 should be added to determine the degree of hyperthyroidism. Figure 3 shows a clinical algorithm for thyroid function testing for suspected thyroid disease and follow-up monitoring recommendations in non-pregnant adults (Ross, 2022). The most common thyroid conditions classified by TSH and FT4 values are outlined in Table 7.
Figure 3
Interpreting Thyroid Function Testing

(Flowchart based on BCGuidelines.ca, 2018)
Table 7
Thyroid Conditions
Diagnosis | TSH | FT4 |
Normal thyroid | Normal | Normal |
Hyperthyroidism (i.e., thyrotoxicosis, Grave’s disease) | ↓ | ↑ |
Primary hypothyroidism | ↑ | ↓ |
Secondary hypothyroidism | ↓ | ↓ |
(Ross, 2022)
Thyroid Antibody Tests
Thyroid antibody tests are a separate subtype of TFTs that measure the level of the blood's thyroid antibodies. Thyroid peroxidase antibody, or antithyroid peroxidase antibodies (TPO), is one of the most common antibody tests currently used in clinical practice. It is performed to determine if hyperthyroidism is autoimmune, such as in Grave's or Hashimoto’s disease. In patients with suspected Hashimoto disease, antithyroglobulin antibody (Tg) testing may also be performed to confirm the diagnosis, as these patients typically have high levels of TPO and Tg. Although the presence of these antibodies can contribute to the initial diagnosis, there is no benefit to monitoring their levels over time. The levels of these antibodies do not indicate disease severity or response to treatment. The presence of thyroid-stimulating immunoglobulin (TSI) or TSH-receptor-thyrotropin receptor antibody (TRAb) strongly supports a diagnosis of Grave's disease. Clinicians should monitor TSI or TRAb levels over time to determine the effectiveness and duration of treatment (Ross, 2022).
Fasting Blood Glucose (FBG) and Glycated Hemoglobin (HbA1C)
FBG and HbA1C are used to diagnose and monitor diabetes. The FBG is one of the most common routine tests. The test can be performed by drawing a blood sample or as a simple fingerstick with a glucometer machine. Patients should be advised to fast for at least eight hours before having the FBG test performed to ensure the accuracy of the results. Patients may drink water and take prescription medications but should not take anything else by mouth. The normal FBG should range between 70–99 mg/dL. Diabetes occurs when the FBG is 126 mg/dL (7.0 mmol/L) or higher, whereas an FBG of 100 mg/dL (5.6 mmol/L) to 125 mg/dL (6.9 mmol/L) is categorized as prediabetes. Prediabetes is the precursor to diabetes, in which the blood glucose levels are higher than normal but not high enough to meet the diagnostic classification of diabetes. The HbA1C measures the average blood glucose levels over the past three months. The patient is not required to fast before the HbA1C test. The normal HbA1C for non-diabetic adults should be less than 5.7%. Diabetes is considered when the HbA1C is 6.5% or higher, whereas an HbA1C of 5.7% to 6.4% is considered prediabetes (ADA, 2023; National Institute of Diabetes and Digestive and Kidney Diseases, 2020).
Coagulation Profile
A coagulation profile measures the blood's clotting capacity and typically includes the prothrombin time (PT), international normalized ratio (INR), activated partial thromboplastin time (aPTT), platelets, and fibrinogen. These tests are performed routinely before surgery to ensure patient safety, to evaluate why a patient is experiencing abnormal bruising or bleeding, or as a screening test for an underlying blood or blood clotting disorder. The normal values for a coagulation profile are listed in Table 8. PT is measured in seconds and refers to the amount of time it takes for the plasma portion of the blood to clot. The INR is a standardized number calculated from the PT result. Usually, the INR is reported and monitored in patients treated with anticoagulant therapy such as warfarin (Coumadin). Patients prescribed warfarin (Coumadin) must undergo routine blood tests at least monthly, but sometimes testing may occur more frequently, such as twice weekly. The testing ensures that the patient’s blood clotting time is within a safe and effective range, as the warfarin (Coumadin) dose is adjusted according to the INR. Higher than normal INR levels indicate a higher risk for bleeding due to the blood's impaired ability to clot. While on warfarin (Coumadin), the INR must not exceed therapeutic thresholds; otherwise, the risk of bleeding heightens. Similarly, blood clots may not be prevented if the patient’s INR is too low. For most warfarin (Coumadin) therapy patients, an INR of 2.0 to 3.0 is generally considered an effective therapeutic range. The aPTT test is performed alongside the PT/INR in patients with suspected bleeding or blood clotting disorders. While the PT test assesses how well all of the coagulation factors in the extrinsic and common pathways of the coagulation cascade are functioning collectively, the aPTT evaluates the clotting factors within the intrinsic and common pathways (Pagana et al., 2022; Shikdar et al., 2023).
Fibrinogen is a plasma glycoprotein synthesized within the liver that helps control bleeding by assisting with blood clot formation. An abnormal fibrinogen level may be due to fibrinolysis (the breakdown of fibrin), congenital or acquired fibrinogen deficiency, or a condition in which the body uses too much fibrinogen (disseminated intravascular coagulation [DIC]). An imbalance of these components poses a risk of acute bleeding, hemorrhage, and death (Kaur & Jain, 2023)
Table 8
Coagulation Profile
Test | Reference Range |
Prothrombin time (PT) | 11–13 seconds |
International normalized ratio (INR) | 0.8–1.1 |
Activated partial thromboplastin time (aPTT) | 25–35 seconds |
Platelets | 150,000–450,000/μL |
Fibrinogen | 200–400 mg/dL (2.0–4.0 g/L) |
(ABIM, 2023; Pagana et al., 2022)
References
American Board of Internal Medicine. (2023). ABIM laboratory test reference ranges - January 2023. https://www.abim.org/Media/bfijryql/laboratory-reference-ranges.pdf
American Diabetes Association. (2023). Diabetes care: Standards of care in diabetes – 2023. The Journal of Clinical and Applied Research and Education, 46(suppl. 1). https://doi.org/10.2337/dc23-S002
Bakerman, P., Strausbauch, P., & Bakerman, S. (2014). Bakerman’s ABCs of interpretive laboratory data. (5th ed.). Interpretive Laboratory Data, Inc.
BCGuidelines.ca. (2018). Thyroid function testing in the diagnosis and monitoring of thyroid function disorder. https://www2.gov.bc.ca/assets/gov/health/practitioner-pro/bc-guidelines/thyroid-function-testing.pdf
Braunstein, G. D. (2022a). Hyperthyroidism. Merck Manual Professional Version. https://www.merckmanuals.com/professional/endocrine-and-metabolic-disorders/thyroid-disorders/hyperthyroidism
Braunstein, G. D. (2022b). Hypothyroidism. Merck Manual Professional Version. https://www.merckmanuals.com/professional/endocrine-and-metabolic-disorders/thyroid-disorders/hypothyroidism
DeGroot, L. J. (2016). Diagnosis and treatment of Graves’ disease. Endotext [Internet]. https://www.ncbi.nlm.nih.gov/books/NBK285548
Goltzman, D. (2023). Diagnostic approach to hypocalcemia. UpToDate. Retrieved June 9, 2023, from https://www.uptodate.com/contents/diagnostic-approach-to-hypocalcemia#H2618010259
Gounden, V., Bhatt, H., & Jialal, I. (2022). Renal function tests. StatPearls [Internet]. https://www.ncbi.nlm.nih.gov/books/NBK507821
Grundy, S. M., Stone, N. J., Bailey, A. L., Beam, C., Birtcher, K. K., Blumenthal, R. S., Braun, L. T., de Ferranti, S., Faiella-Tommasino, J., Forman, D. E., Goldberg, R., Heidenreich, P. A., Hlatky, M. A., Jones, D. W., Lloyd-Jones, D., Lopez-Pajares, N., Ndumele, C. E., Orringer, C. E., Peralta, C. A., Saseen, J. J., … Yeboah, J. (2019). 2018 AHA/ACC/AACVPR/AAPA/ABC/ACPM/ADA/AGS/APhA/ASPC/NLA/PCNA Guideline on the Management of Blood Cholesterol: Executive Summary: A Report of the American College of Cardiology/American Heart Association Task Force on Clinical Practice Guidelines. Journal of the American College of Cardiology, 73(24), 3168–3209. https://doi.org/10.1016/j.jacc.2018.11.002
Joseph, J. J., Deedwania, P., Acharya, T., Aguilar, D., Bhatt, D. L., Chyun, D. A., Di Palo, K. E., Golden, S. H., & Sperling, L. S. (2022). Comprehensive management of cardiovascular risk factors for adults with type 2 diabetes: A scientific statement from the American Heart Association. Circulation, 245, e722-e759. https://doi.org/10.1161/CIR.0000000000001040
Kaur, J., & Jain, A. (2023). Fibrinogen. StatPearls [Internet]. https://www.ncbi.nlm.nih.gov/books/NBK537184
Kidney Disease Improving Global Outcomes. (2021). 2021 clinical practice guideline for the management of glomerular disease. Kidney International, 100(45), S1-S276. https://kdigo.org/wp-content/uploads/2017/02/KDIGO-Glomerular-Diseases-Guideline-2021-English.pdf
Lala, V., Zubair, M., & Minter, D. A. (2023). Liver function tests. StatPearls [Internet]. https://www.ncbi.nlm.nih.gov/books/NBK482489
LeFevre, M. L., & U.S. Preventive Services Task Force (2015). Screening for thyroid dysfunction: U.S. Preventive Services Task Force recommendation statement. Annals of Internal Medicine, 162(9), 641–650. https://doi.org/10.7326/M15-0483
Lindenmeyer, C. C. (2022). Laboratory tests of the liver and gallbladder. Merck Manual Professional Version. https://www.merckmanuals.com/professional/hepatic-and-biliary-disorders/testing-for-hepatic-and-biliary-disorders/laboratory-tests-of-the-liver-and-gallbladder
Longo, D. L. (2017). Harrison’s hematology and oncology (3rd ed.). McGraw-Hill Education.
MedlinePlus. (2022). CBC blood test. https://medlineplus.gov/ency/article/003642.htm
National Institute of Diabetes and Digestive and Kidney Diseases. (2020). Diabetes & prediabetes tests. https://www.niddk.nih.gov/health-information/professionals/clinical-tools-patient-management/diabetes/diabetes-prediabetes
Pagana, K. D., Pagana, T. J., & Pagana, T. N. (2022). Mosby’s manual of diagnostic and laboratory tests. (7th ed.). Elsevier.
Pillai, A. A., Fazal, S., Mukkamalla, S. K. R., & Babiker, H. M. (2023). Polycythemia. StatPearls [Internet]. https://www.ncbi.nlm.nih.gov/books/NBK526081
Ross, D. S. (2022). Laboratory assessment of thyroid function. UpToDate. Retrieved June 20, 2023, from https://www.uptodate.com/contents/laboratory-assessment-of-thyroid-function
Selchick, F. (2020a). Laboratory report flagging abnormal results [Image].
Selchick, F. (2020b). Comprehensive metabolic panel (CMP) [Image].
Shikdar, S., Vashisht, R., & Bhattacharya, P. T. (2023). International normalized ratio (INR). StatPearls [Internet]. https://www.ncbi.nlm.nih.gov/books/NBK507707
Shrimanker, I., & Bhattarai, S. (2023). Electrolytes. StatPearls [Internet]. https://www.ncbi.nlm.nih.gov/books/NBK541123
Testing.com. (2021). Deciphering your lab report. https://www.testing.com/articles/how-to-read-your-laboratory-report
Vaezi, Z., & Amini, A. (2022). Familial hypercholesterolemia. StatPearls [Internet]. https://www.ncbi.nlm.nih.gov/books/NBK556009